Understanding Our Future: An Interactive Map of Sea Level Rise

Rendergeek
July 1st, 2024

Discover through a map of sea level rise how your locale may fare against the rising tides. This article takes you through interactive maps that predict future risks with clarity and precision, equipping you with visual tools to understand and act on the threat to your community.
Exploring Sea Level Rise Maps
 Image by filo, iStock
Sea level rise maps are not just about providing data; they are about visualizing impact and assessing protection difficulties at community levels. They serve as an essential tool in understanding the potential consequences of sea level rise and helping us prioritize actions. Imagine having the ability to visualize your city, your neighborhood, or even your street, impacted by varying degrees of sea level rise. This is the power of interactive sea level rise maps.
Interactive sea level rise maps, like those offered by Surging Seas, provide a clear visualization of areas vulnerable to near-term flooding due to various combinations of sea level rise, storm surge, tides, and tsunamis. These maps allow users to see data layers and customize the map according to different scenarios, providing a more personalized and relatable understanding of the impacts of sea level rise.
Interactive Map Features
Interactive map features go beyond just presenting data; they bring the data to life. The Sea Level Rise Viewer offered by the NOAA Office for Coastal Management is a perfect example of this. The viewer includes interactive web mapping to visualize the impact of coastal flooding or sea level rise up to 10 feet above average high tides, providing a clear visual representation of potential sea level rise scenarios.
Users can explore the impact of future flooding effects on local landmarks with photo simulations, expose the depth and frequency of anticipated flooding, and even share maps and insights via email and social media. The viewer also offers educational materials such as video tutorials and FAQs to help users understand and effectively use the tool. These features, coupled with data on socio-economic vulnerability, wetland loss, and the confidence level of the mapping data, make the Sea Level Rise Viewer a comprehensive tool for understanding sea level rise.
Mapping Confidence
While the features of the Sea Level Rise Viewer are impressive, it is the confidence in the underlying data that truly sets it apart. The viewer presents a confidence score for its data, underscoring the reliability and precision of the sea level rise projections it illustrates. Users are provided with documentation, tutorials, and FAQs to ensure a comprehensive understanding of the data and methods underpinning the viewer.
The confidence in the data comes from:
The use of improved elevation data, which often reveals higher-risk projections for coastal flooding
The Surging Seas Risk Zone Map, which employs the ‘bathtub method’ to identify areas below varying water levels, a crucial piece of information for understanding potential flooding scenarios
The accurate data and the reliability of the mapping methods, which serve as a solid foundation for decision-making processes.
The Science Behind Sea Level Rise
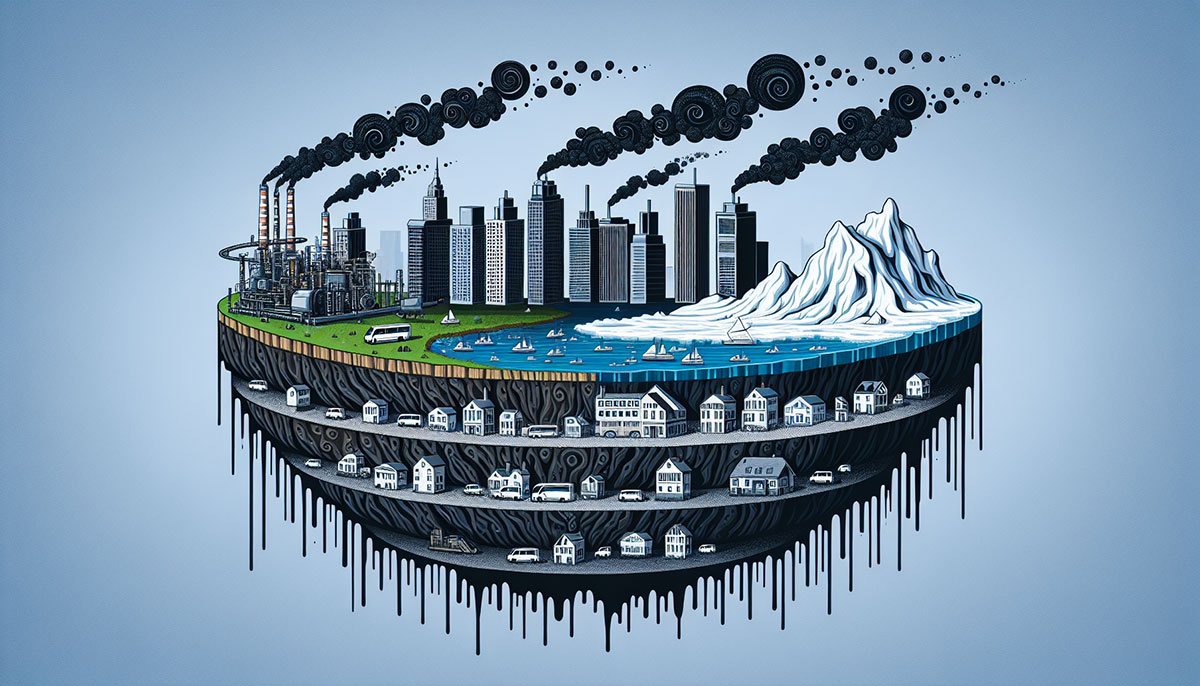 Generated by SurferAI
Having explored the mapping of sea level rise, it’s now essential to delve into the science behind it. Why is sea level rising, and how fast is it occurring? To put things into perspective, the global mean sea level has risen approximately 8-9 inches since 1880. This acceleration of global mean sea level rise since around 1970 is primarily due to human activities, with a notable shift in the main factor from thermal expansion of ocean water to ice sheet and glacier melt after 2000.
Sea level rise is caused by the thermal expansion of sea water as it warms and the addition of fresh water from melting land ice. As the planet warms due to increased greenhouse gas emissions, more ice melts into the ocean, and the ocean itself warms and expands. This process leads to an increase in sea level, which can have devastating impacts on coastal communities worldwide.
Global Sea Level Projections
With the understanding of why and how sea level is rising, we can now explore what the future might hold. Global mean sea level rise is anticipated to be at least one foot above the year 2000 levels by the end of this century, even with lower greenhouse gas emissions. Depending on emissions scenarios, projected sea level rise by the year 2100 is estimated to range from 0.28 to 1.02 meters.
However, if greenhouse gas emissions continue on an increasing trajectory, sea level could rise by up to 2.5 meters by the year 2100. There’s even the possibility of reaching up to 5 meters by 2150 if rapid ice sheet disintegration occurs. It’s important to note that political and societal choices significantly influence long-term sea level rise, as different pollution pathways can yield varying scenarios.
Regional Variations
While understanding global sea level projections is crucial, we also need to recognize that sea level rise won’t be uniform across the globe. Regional variations are influenced by factors such as differences in wind strength, ocean currents, and the distribution of heat within ocean depths. For example, in the United States, variations in sea level rise along the East Coast, West Coast, and Gulf Coast are further exacerbated by local factors including ground settling, erosion, and regional ocean currents, with the Gulf Coast experiencing the fastest rates.
Moreover, parts of the United States along the East, West, and Gulf coasts are anticipated to experience relative sea level rise exceeding the global average, with projections estimating a rise of 10-12 inches over the next 30 years. These regional variations highlight the need for localized sea level rise maps and targeted response strategies.
Coastal Flooding Impacts
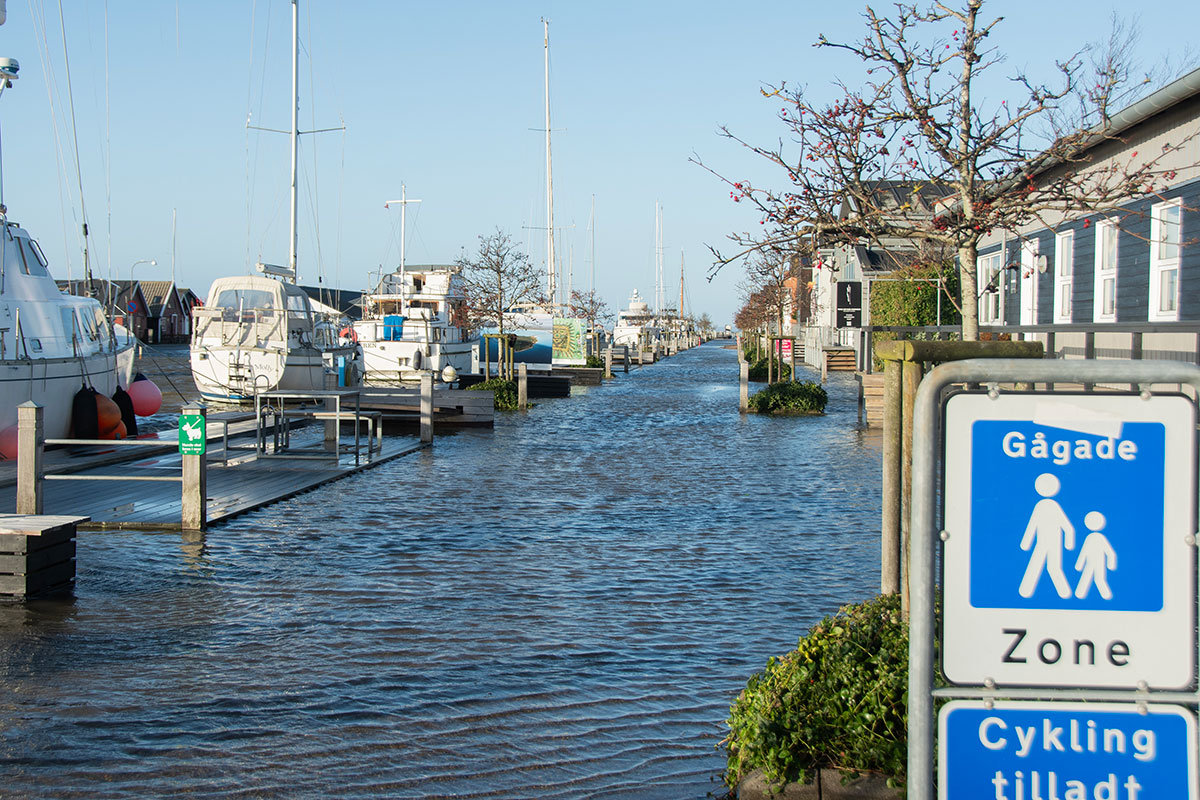 Image by linephoto, iStock
Understanding sea level rise and its regional variations sets the stage for assessing its impacts, particularly those related to coastal flooding. Over 40 percent of Americans live near the coast where more than $1 trillion of property and structures are at risk from coastal flooding. Moreover, coastal flooding can compromise drinking water and wastewater infrastructure, leading to an increased risk of exposure to pathogens and harmful chemicals.
Cities, such as New York, are facing the threat of increased flooding, potentially affecting nearly 4% of the city’s population with the current level of warming. This, combined with the record global mean sea level reached in 2022 and the link between increased storm activities and rising sea levels, presents significant risks to coastal regions.
High Tide Flooding and Nuisance Flooding
One aspect of coastal flooding that’s becoming increasingly important is high tide flooding. By 2050, ‘moderate’ coastal flooding is expected to occur more than 10 times as frequently as it does today. High tide flooding is already impacting low-lying areas through road closures and storm drain inundations, with recurring events leading to substantial damage over time.
Coastal cities have set specific thresholds to define ‘nuisance’ flooding, which encompasses minor impacts like ineffective storm drains and road closures when these thresholds are exceeded. Increased flooding presents a significant risk to over 60,000 miles of roads and bridges in US coastal floodplains, affecting transportation and the ability to respond to emergencies. The East Coast of the United States has been particularly affected, experiencing an escalation in the number of high tide flood days over the last decade.
Marsh Migration and Wetland Loss
Wetlands play a crucial role in mitigating the impacts of coastal flooding. However, they are also under threat from sea level rise. The resilience of wetlands to sea level rise is determined by factors such as the rate of sea level rise itself, coastal development, and the marsh’s capacity for vertical growth. As coastal flooding increases, wetlands are transformed from vegetated areas into open water, leading to a significant loss of wetland functions important for environmental protection.
In addition to ecological impacts, coastal flooding can cause disruptions such as road closures and damage to below-ground infrastructure, exacerbating the degradation of wetlands. Understanding these impacts is crucial for the development of strategies to preserve wetlands and mitigate the impacts of coastal flooding.
Visualizing Sea Level Rise Scenarios
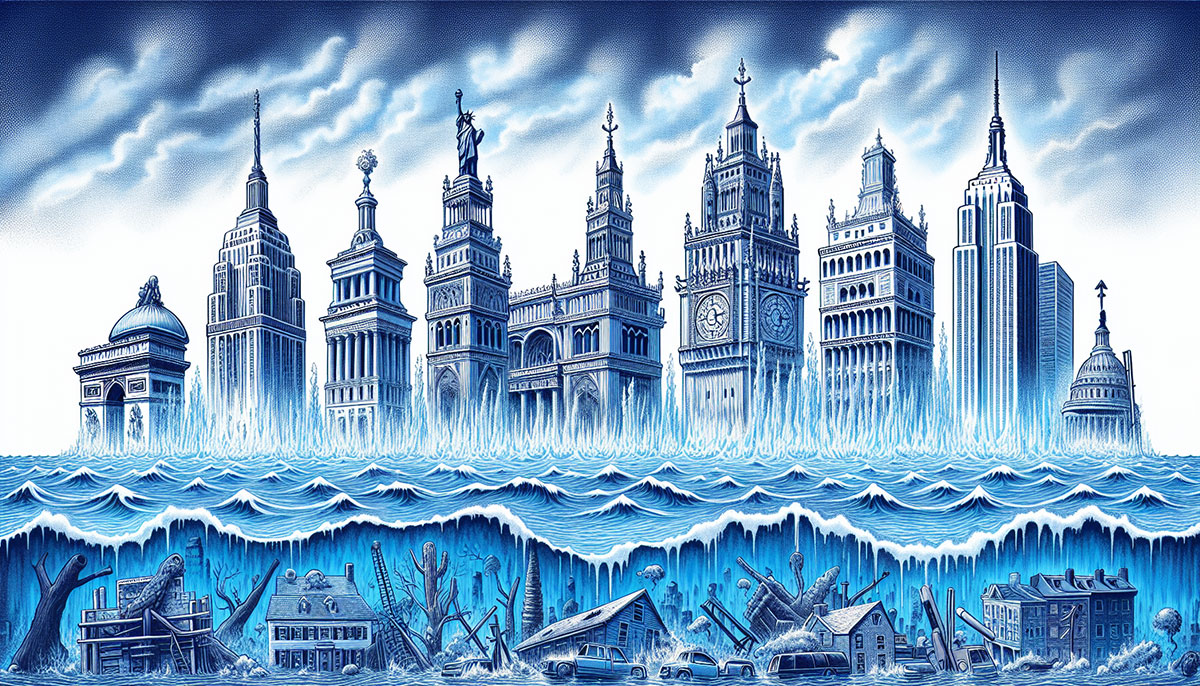 Generated by SurferAI
Having discussed the impacts of sea level rise, it’s now time to explore how we can visualize potential future scenarios. Sea level rise maps and photo simulations are essential tools for visualizing potential future flooding and transformation of landscapes and urban environments. These tools are instrumental in assessing the community-level impacts of sea level rise, aiding in the preparedness and adaptation strategies for affected areas.
The Sea Level Rise Viewer offered by the NOAA Office for Coastal Management is a great example of this. It allows users to visualize the impacts of coastal flooding or sea level rise up to 10 feet above average high tides, providing a vivid picture of submersion risks for landmarks in various warming degrees. This visualization capability is crucial in driving home the potential impacts of sea level rise and the urgent need for action.
Impact on Local Landmarks
One of the most tangible ways to understand the impacts of sea level rise is by visualizing its effects on local landmarks. Some examples include:
The Statue of Liberty, which could face flooding with a three-degree Celsius global temperature increase, resulting in a sea-level rise of nearly 21 feet.
The Temple of Literature in Hanoi, which is at risk of flooding under the same temperature increase scenario.
The Lungshan Temple in Taipei, which is also at risk of flooding under the same temperature increase scenario.
These examples highlight the potential risks and consequences of sea level rise on iconic landmarks around the world.
These visualizations bring the impacts of sea level rise closer to home, making them more relatable and impactful. Various sites of cultural significance around the world are at risk of submersion or damage due to rising sea levels, and photo simulations provided by interactive mapping tools help us visualize community level impacts and potential future flooding impacts.
Assessing Levee Data and Flood Frequency
Another crucial aspect of understanding and visualizing sea level rise is assessing levee data and flood frequency. Levee data is essential for:
Accurately assessing the flood risks
Highlighting the vulnerability of cities and landmarks that have faced flooding challenges, such as New York and Venice
Categorizing flood risk
Evaluating levee performance during flood events
Projecting the potential consequences for communities protected by levee systems.
Comprehensive risk assessments for levees take into account factors such as:
the probability of flooding
the conditions and performance of levees during high-water events
the possible outcomes of levees being overtopped or failing
This information is crucial in informing the design and construction of future coastal infrastructure.
Utilizing Sea Level Rise Maps for Decision-Making
 Image by Rudzhan Nagiev, iStock
With a deeper understanding of sea level rise and its potential impacts, we can now explore how this information can be used for decision-making. Sea level rise maps are essential tools for informing policy and local decision-makers about the risks associated with coastal flooding and sea level rise. These maps provide tailored local information, highlighting the specific risks of sea level rise and coastal flooding to individual regions. This localized information aids policy makers in understanding and responding effectively to the challenges posed by sea level rise.
This information is particularly crucial for industries such as maritime, oil and gas, and aquaculture, which are directly affected by sea level rise and coastal flooding. Understanding the potential impacts of these phenomena can help these industries develop more resilient strategies and make informed decisions that take into account the risks and challenges posed by sea level rise.
Maritime, Oil and Gas, and Aquaculture
For the maritime industry, sea level rise maps can be used to:
Assess and manage the risks of inundation and storm surges
Ensure the protection of ports critical to global trade
Gauge the risks of extreme weather events which pose operational disruptions and environmental hazards
Sea level rise necessitates significant investments in defenses for European ports to prevent impacts on the transport and logistics chain. Maritime industries rely on these maps to make informed decisions and mitigate potential risks.
Additionally, oil and gas infrastructure, including platforms, refineries, and processing plants, face increased risks from sea level rise such as damage, spills, and the necessity for higher design thresholds. For aquaculture, applications like ERMA, which integrates studies on species with visualizations of environmental impacts such as those caused by oil spills, are extremely beneficial. These maps provide concise summaries of coastal resources at risk, assisting in disaster planning and mitigation in collaboration with the Environmental Protection Agency.
Coastal Construction and Infrastructure Planning
Sea level rise maps are also crucial for coastal construction and infrastructure planning. They allow for the identification of areas at risk of future flooding, erosion, and infrastructure damage, thereby guiding construction decisions. Infrastructure planning for coastal areas now incorporates resilient design principles to ensure structures can endure the impacts of climate change and sea level variations.
Projected increases in extreme weather events and sea level rise are key considerations in the planning and ongoing maintenance of coastal construction projects. Understanding these risks can help inform more resilient design strategies and ensure that future infrastructure can withstand the impacts of sea level rise.
Tools and Resources for Sea Level Rise Mapping
With the increasing need for accurate and accessible sea level rise information, a variety of tools and resources have been developed to aid in sea level rise mapping. Some of these tools and resources include:
NOAA’s Office for Coastal Management, which provides high-accuracy coastal elevation data via its Sea Level Rise Viewer
Climate Central, which offers the CoastalDEM, a high-accuracy digital elevation model used to model land elevation outside the U.S. for coastal flood risk mapping
Continuous satellite monitoring, which is used for tracking global ocean levels and ice sheet thickness to inform future adaptations to sea level changes
These tools and resources are valuable for researchers, policymakers, and communities in understanding and preparing for the impacts of sea level rise.
Other resources, such as Skyhook, provide data related sources used to count wireless routers and cellphone towers on a 100m grid, supplementing the geographical data needed for mapping. Many organizations, including The Schmidt Family Foundation, The Kresge Foundation, and The Rockefeller Foundation, have financially supported Climate Central and its sea level program. These tools and resources are crucial for providing accurate and accessible sea level rise data and maps, aiding in decision-making processes across various industries.
National Oceanic and Atmospheric Administration (NOAA)
Among the various resources available for sea level rise mapping, NOAA’s Sea Level Rise Viewer stands out for its high-accuracy coastal elevation data. The viewer offers the following features:
Detailed elevation maps
Accounts for local and regional tidal variations
Allows users to visualize the impacts of coastal flooding or sea level rise, up to 10 feet above average high tides
This tool provides valuable information for understanding potential risks and planning for resilience.
The viewer also incorporates data on flood frequency and related factors such as socio-economic vulnerability and wetland loss. This comprehensive data integration helps users understand and manage flood risks, making the Sea Level Rise Viewer a valuable tool for sea level rise mapping and decision-making.
Climate Central
Another resource for sea level rise mapping is Climate Central. Their sea level rise viewer visualizes potential future flooding risks, providing a clear picture of potential impacts. The maps are informed by the latest sea-level projections, such as those from the IPCC’s Sixth Assessment Report and the 2022 Sea Level Rise Technical Report by a U.S. government interagency task force.
Climate Central’s viewer, coupled with their proprietary CoastalDEM elevation model, provides a comprehensive tool for mapping coastal flood risks outside the U.S. These tools, along with the detailed sea level rise projections, provide valuable resources for understanding and planning for the impacts of sea level rise.
Additional Resources
In addition to NOAA and Climate Central, there are several other online tools and resources available for sea level rise mapping and aquaculture site planning. Aquaculture site selection is supported by online screening tools that integrate various data relevant to sea level rise and coastal conditions. The Gulf AquaMapper, for example, provides a spatial screening service ideal for managers looking to identify suitable zones for aquaculture development in the Gulf of Mexico.
On a national scale, the National AquaMapper offers visualization of multiple siting parameters to aid the screening of ocean areas for aquaculture across United States offshore waters. Companies like Actea also provide climate projections and interactive map tools, which furnish climate risk reports for specific sites to inform industry stakeholders in aquaculture site planning.
Summary
We’ve embarked on a journey through the world of sea level rise, exploring its impacts, the science behind it, and the tools used to visualize its potential future scenarios. From understanding the importance of sea level rise maps to exploring the various resources available for mapping sea level rise, it’s clear that this information is invaluable for decision-making, particularly for industries such as maritime, oil and gas, aquaculture, and construction. As we navigate the era of climate change, the understanding of sea level rise and the tools to visualize its impacts have never been more critical.
Our location
Turning Industrial Visions into Clear Imagery
2026 © Rendergeek. All Rights reserved. |Sitemap|Privacy Notice
