
Empowering Efficiency: The Latest Trends in Industrial Visualization Technology
Rendergeek
April 23rd, 2024
Are you exploring the role of industrial visualization in streamlining operations and fostering innovation? Industrial visualization is a transformative force in modern industry, providing real-time, detailed visual data that helps companies minimize costs, improve collaboration, and accelerate product development. This article dives into the latest trends, applications, and real-world impacts of industrial visualization to illuminate its crucial role in elevating industrial efficiency and driving technological advancement.
The Power of Industrial Visualization for Product Development
 Generated by SurferAI
Utilizing industrial visualizations in product development can significantly transform the process. These advanced tools offer significant benefits such as improved communication, faster decision-making, and reduced costs. Key features of industrial visualization software include realistic visual representations, a comprehensive user interface, and essential tools for creating captivating product visuals.
Advanced rendering capabilities like scientifically accurate materials, 3D paint, and HDRI lighting enhance the effectiveness of product visuals. Interactive real-time rendering allows for timely adjustments, facilitating better design decision-making and accelerating the product development process. Tools like KeyShot provide rapid rendering time and network rendering capabilities that enhance operational efficiency.
Companies that leverage industrial process visualization are able to:
Deliver superior products and services
Reduce operational costs
Drive innovation and growth
Become critical assets for product developers in diverse industries.
Enhanced Collaboration
Collaboration is enhanced through real-time rendering, which allows multiple stakeholders to interact simultaneously with virtual environments and refine designs. This interactive capability breaks down communication barriers and fosters a shared understanding among team members, leading to better design outcomes.
Additionally, dashboards streamline communication and collaboration by enabling shared access to essential information for all involved parties. Visualization tools that offer extensive customization and data integration from multiple sources can significantly benefit industries by tailoring visualizations to their particular needs. Thus, visualization tools not only enhance collaboration but also provide a platform for innovation.
Rapid Prototyping and Iterations
Advanced visualization technology features real-time rendering, which dramatically influences the speed and efficiency of the prototyping phase in product development. With this technology, designers can quickly visualize changes, substantially reducing the time required to see the effects of modifications made during the prototyping process.
The ability to explore various design options without being hindered by long rendering times encourages experimentation and innovation in product design. Consequently, rapid prototyping facilitated by real-time rendering leads to a decrease in time-to-market for new products, providing a competitive edge for manufacturers in various industries.
Informed Decision-Making
Industrial visualizations contribute significantly to informed decision-making by offering precise visual feedback on design selections. By leveraging the ability to view and analyze historical data, developers can identify trends and insights that inform future decisions.
Real-time visualization of data allows for:
Immediate recognition of patterns, trends, and discrepancies
Informed decisions that can optimize operations and reduce costs
Greater forecasting accuracy, facilitating cost-effective resource allocation and decision-making
Manufacturers using real-time data visualization can achieve these benefits.
By visualizing OEE data, a critical metric that measures a manufacturer’s productivity, businesses can make informed decisions to optimize efficiency. Therefore, dynamic data visualization tools are becoming an indispensable part of the toolkit for businesses aiming to scale and meet their performance goals.
Industrial Visualization Applications in Key Industries
 Created by RenderGeek
Industrial visualization technology has been successfully applied across various sectors, providing tailored solutions that cater to the unique needs of each industry. Some industries that have reaped the benefits of visualization technology include:
Maritime
Oil and gas
Aquaculture
Construction
These industries, with their extensive experience, have revolutionized their company operations and set new benchmarks in their respective fields.
In the maritime industry, augmented reality applications have improved navigational safety and efficiency. In the oil and gas sector, visualization solutions have enhanced equipment management and energy distribution, leading to optimized operations. In aquaculture, visualization tools coupled with machine learning have boosted the efficiency of fish farm operations. In the construction industry, 3D rendering services have improved project management and safety.
RenderGeek, as a frontrunner in industrial visualization, has significantly contributed to these transformations. We will now explore more about the applications of visualization technology across these key industries.
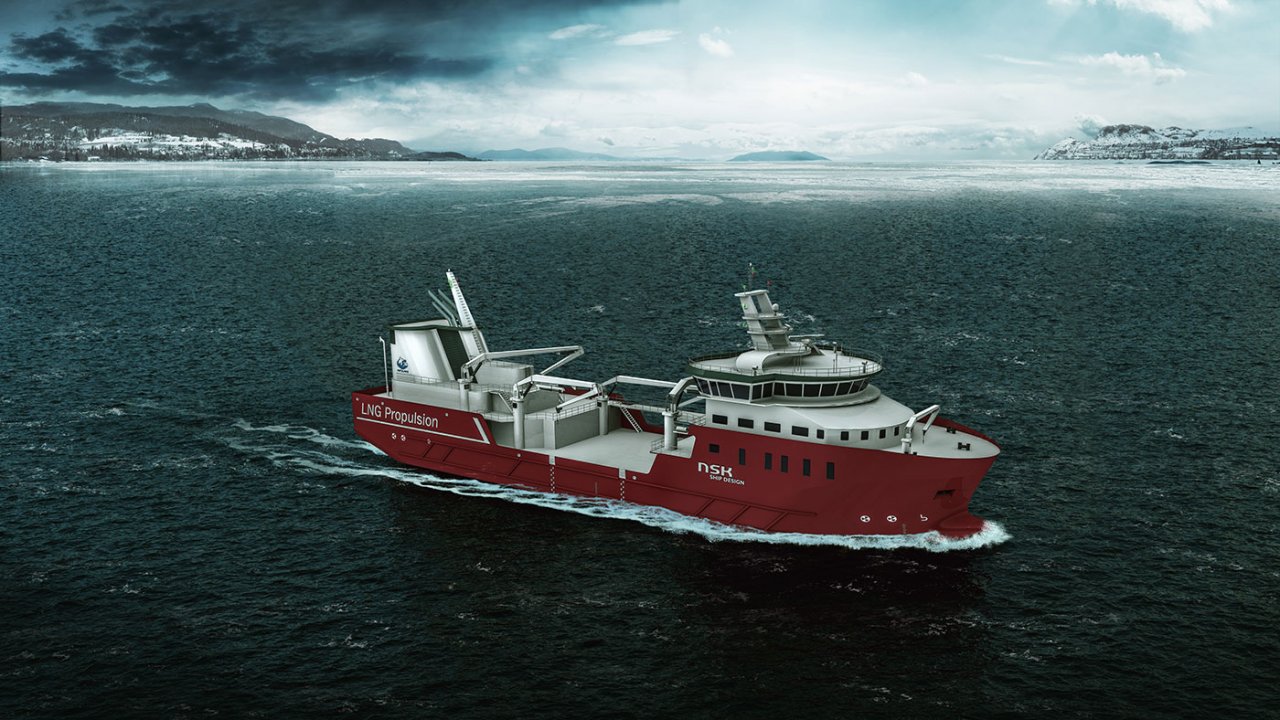
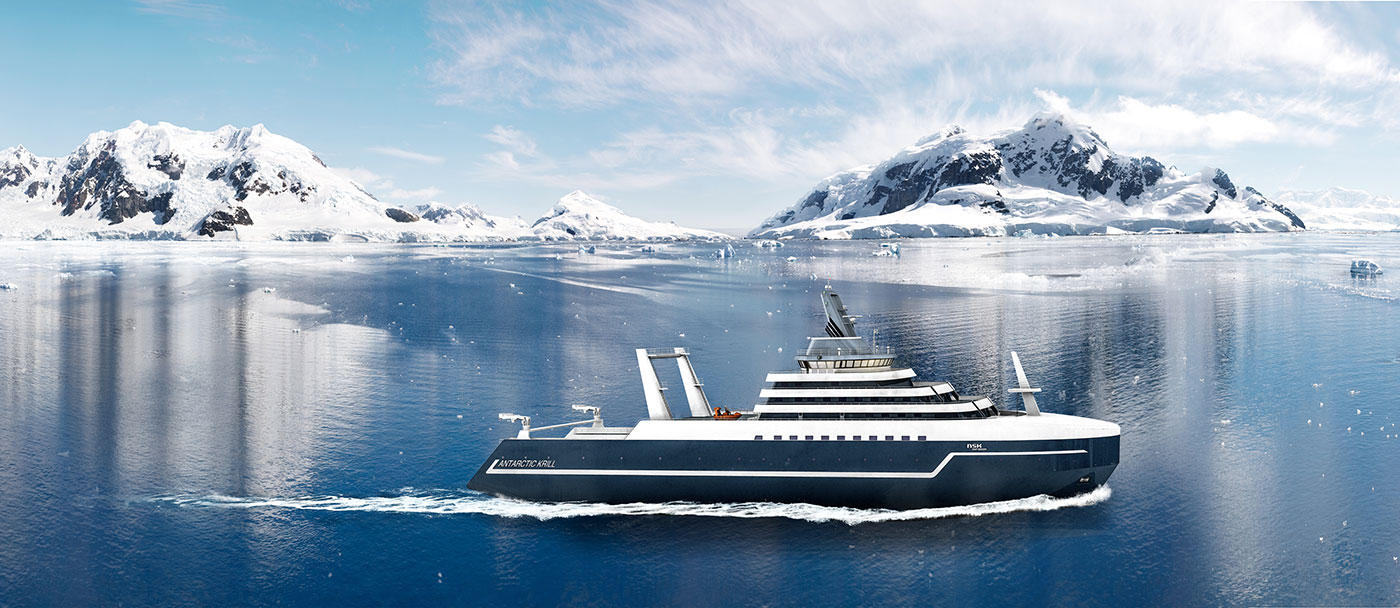
Maritime Industry
The maritime industry has undergone a significant transformation due to visualization technology. Augmented reality applications are now being used to enhance real-time navigational information, providing a quantum leap in safety standards. Shipping lane information and collision alerts are overlaid directly onto an officer’s field of view, elevating the standard of navigation safety and offering insight into the current status of the vessel’s surroundings.
RenderGeek’s visualizations have played a significant role in this transformation. By offering technologically advanced solutions, RenderGeek has significantly improved maritime navigational systems, shaping the future of the maritime industry.
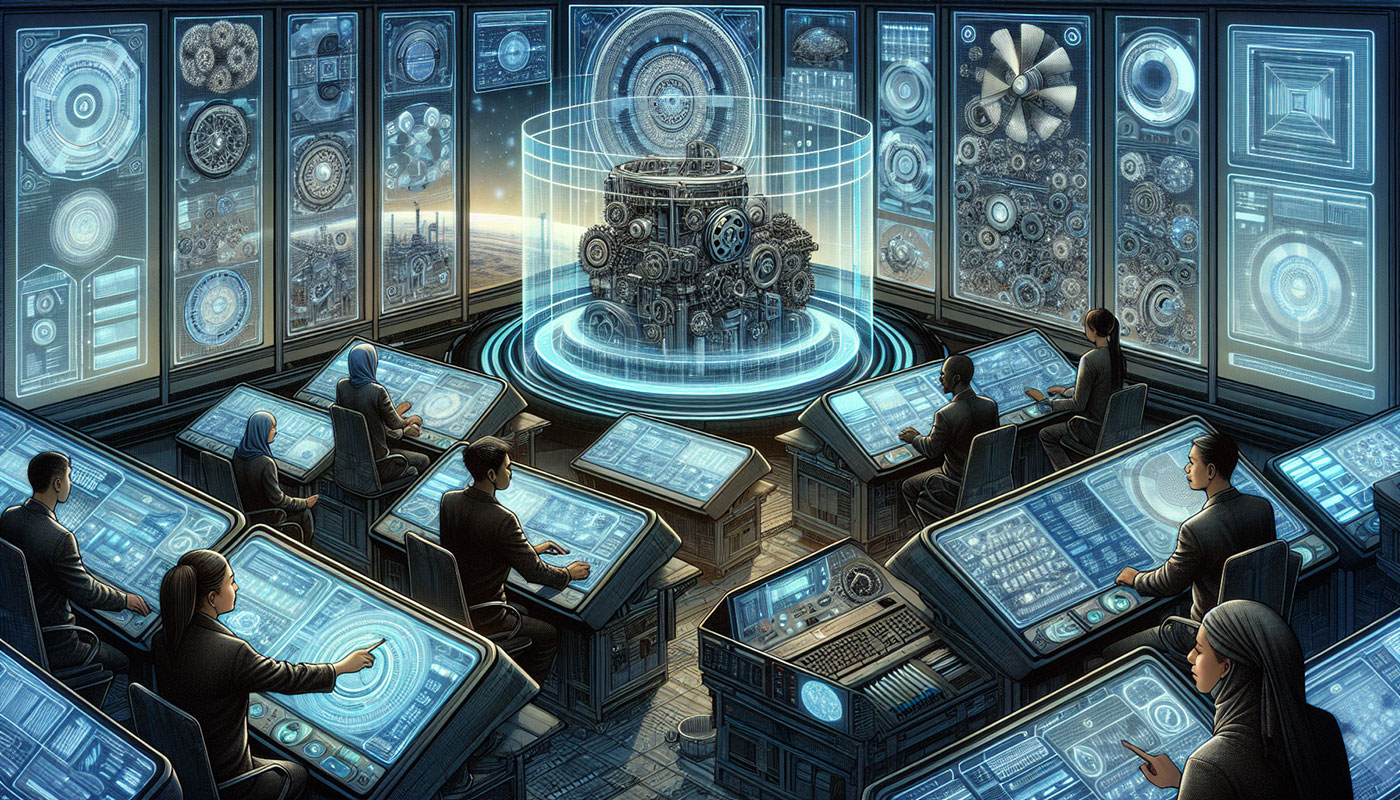
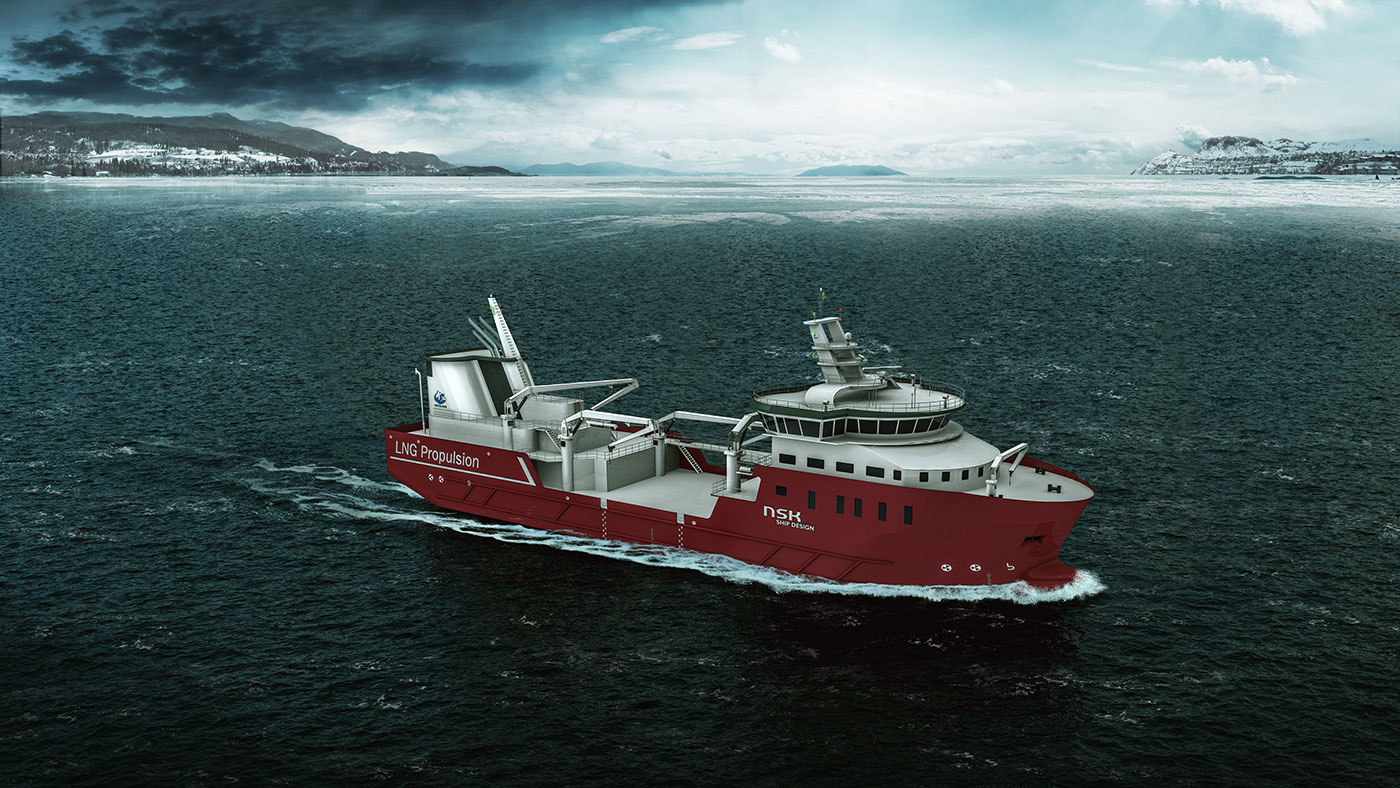
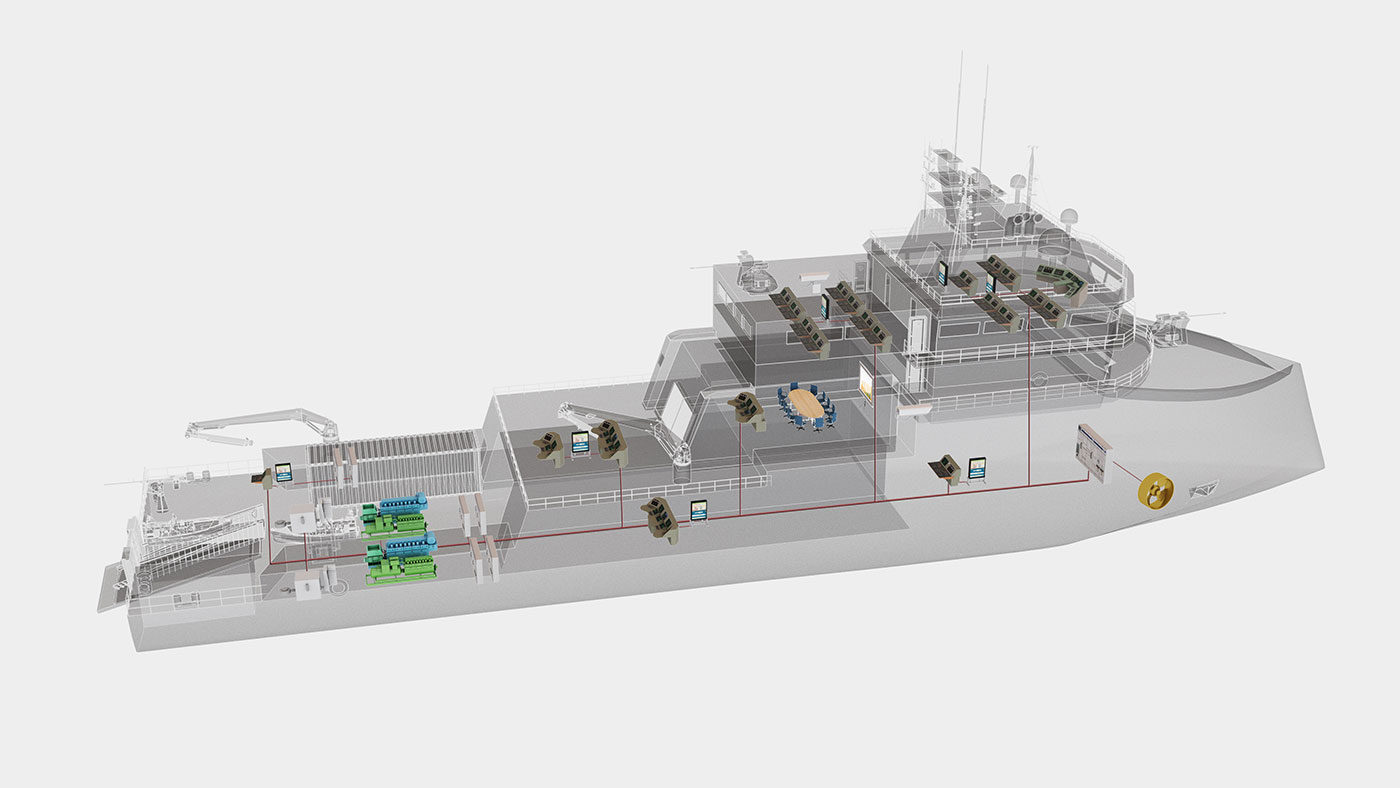
Oil and Gas Industry
The oil and gas industry has been deeply influenced by visualization solutions. RenderGeek’s visualization solutions enhance equipment management, improving reporting, inventory, and maintenance scheduling. ETAP software aids in the management of energy distribution networks, facilitating critical operations and supporting risk mitigation through detailed visualization.
Data visualization is utilized to interpret seismic data, drilling logs, and production data to enhance decision-making and operational optimization. Geologists and engineers use data visualization tools for seismic analysis to identify potential oil and gas reserves more accurately.
Thus, visualization technology is an integral part of the oil and gas industry, shaping its future.
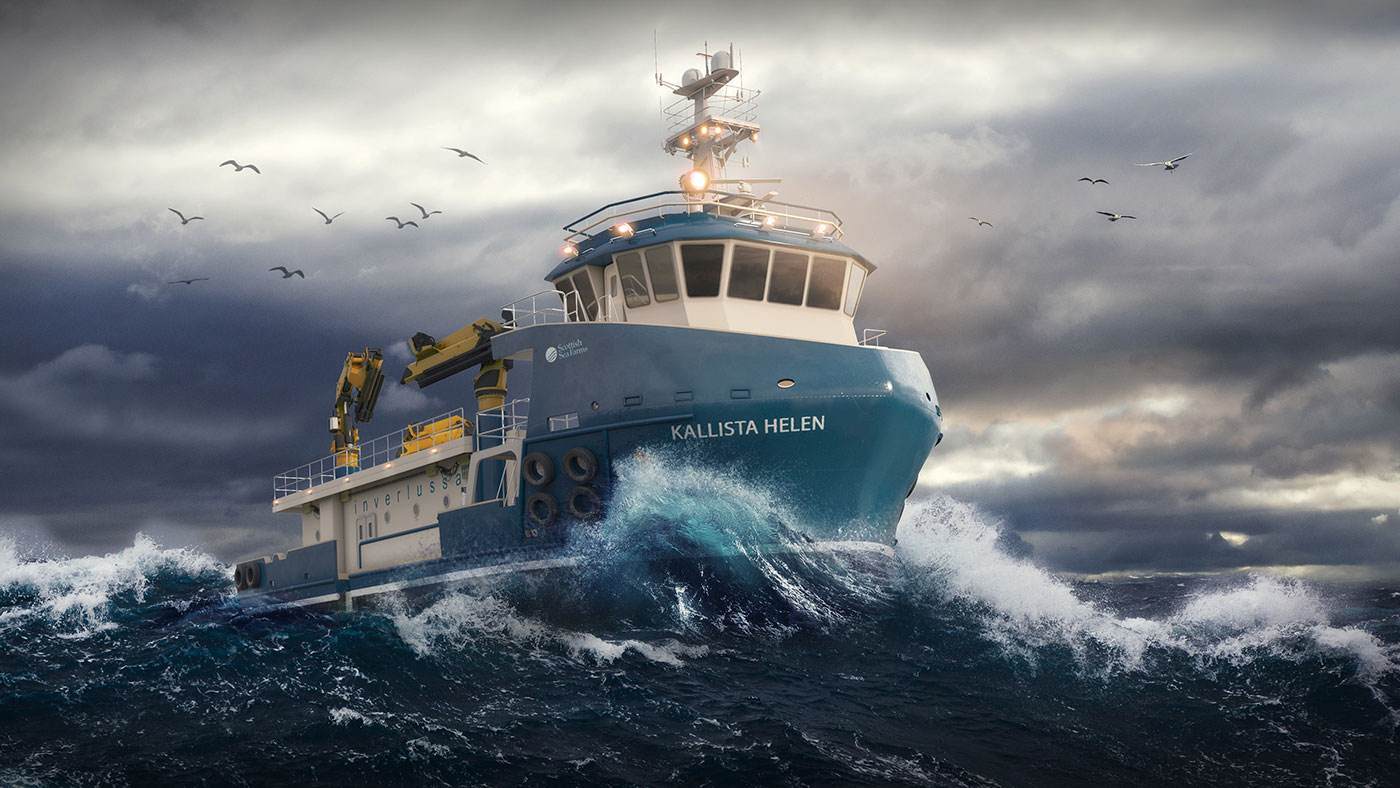
Aquaculture Industry
The aquaculture industry has benefited from visualization tools and machine learning in monitoring fish health and analyzing growth rates. RenderGeek’s visualization tools enable the visualization of data collection points and analysis of factors influencing growth, enhancing decision-making and farm operations.
Through constant data evaluation, RenderGeek’s technology aids in swiftly detecting and managing anomalies in water quality, crucial for maintaining optimal conditions for fish growth and health. Real-time data analytics have facilitated a reduction in waste and optimized feeding and disease management. This comprehensive approach not only aids in sustaining aquaculture practices but also contributes to the profitability and efficiency of operations.
Construction Industry
The construction industry has seen improvements in project management and safety through the use of 3D rendering services. RenderGeek’s 3D rendering services aided project management efficiency for Flatiron’s innovative mixed-use complex, providing clear visuals that facilitated project approval and investor engagement.
RenderGeek’s creation of detailed 3D architectural renderings for projects like a coastal villa and a city bridge not only serves as marketing material but also as a tool to enhance safety by visualizing critical construction aspects. Thus, visualization technology is transforming the construction industry, providing a safer and more efficient environment for project development and management.
Addressing Pain Points with RenderGeek's Industrial Visualizations
 Created by RenderGeek
RenderGeek’s industrial visualizations have played a key role in resolving issues like communication gaps, inefficient workflows, and elevated operational costs. By translating complex data into clear information, industrial visualizations bridge communication gaps between technical experts and non-experts.
Real-time visualizations in industrial settings offer several benefits, including:
Continuous monitoring of operations
Prompt identification and resolution of inefficiencies
Cost savings
Immediate access to vital data
Recognition and resolution of inefficiencies in manufacturing workflows
These visualization technologies enable businesses to improve their operations and increase efficiency.
RenderGeek’s industrial visualizations thus offer an all-encompassing solution for businesses, addressing their unique challenges and facilitating their journey towards operational efficiency.
Effective Communication
Effective communication is fundamental to successful operations, and visualization has proven to revolutionize this aspect. Industrial visualizations make complex technical data accessible in visual formats understandable to both subject matter experts and non-experts.
Visual content such as diagrams and models are more effective for communicating complex concepts than verbal or written descriptions, enhancing learning and recall through the picture superiority effect. Visual tools like Kanban boards and digital dashboards help manufacturing teams monitor processes in real-time, making quick decision-making possible and increasing operational efficiency.
Streamlined Processes
Visualization tools play a critical role in making industrial processes more efficient. Real-time visualizations allow for continuous monitoring of operations, leading to the prompt identification and resolution of inefficiencies, resulting in cost savings.
Manufacturing dashboards provide real-time, visual representations of a manufacturing process or facility, aiding in the easy interpretation of production KPIs. Some benefits of using manufacturing dashboards include:
Easy interpretation of production KPIs
Comprehensive view of production
Mapping production metrics to physical space
Displaying critical product data
Streamlining processes
Enhancing operational efficiency
Cost Savings
Cost savings can be significantly achieved through visualization technologies. By providing immediate access to vital data and resources, these technologies enable businesses to recognize and resolve inefficiencies in manufacturing workflows on the shop floor.
SCADA visualizations provide real-time display of equipment, installation, or process statuses, monitoring a variety of operational parameters like temperature and flow rates. Production target dashboards offer insights into completed parts against hourly goals, highlighting the most efficient shifts, lines, and employees. Thus, visualization tools play a crucial role in cost-effectiveness by identifying and resolving inefficiencies.
Choosing the Right Visualization Tools for Your Industry
 Created by RenderGeek
Selecting appropriate visualization tools is an essential step in harnessing the potential of industrial visualization. Essential factors to consider include:
User-friendliness
Customization
Integration
Scalability
Performance
The ideal data visualization tool should:
Provide a range of visualization styles
Be user-friendly
Manage large data sets effectively
Support multiple output formats such as images and interactive graphics
Customization is key in rendering software to tweak user interfaces and material properties, while integration features ensure compatibility with various 3D modeling platforms and facilitate quick data transfers.
Furthermore, visualization tools must be able to handle increasing amounts of data as businesses grow, necessitating a scalable approach. Innovative technologies such as AI can help visualization tools adapt by learning from new patterns of data. By considering these factors, businesses can choose the right visualization tools that align with their specific needs and goals.
User-Friendly Interfaces
Effective visualization tools must possess user-friendly interfaces. Intuitive design and good documentation of data visualization apps are critical for users to create and interact effectively with visual data representations.
User-friendly interface tools like Lucidchart help to simplify complex technical information for non-technical stakeholders. Ease-of-use in visualization tools allows non-technical users to begin without unnecessary complexities, relying on well-considered default choices. Thus, a user-friendly interface enhances the usability and efficiency of visualization tools.
Customization and Integration
Customization and integration form the cornerstone of effective visualization tools. They ensure compatibility with various platforms and facilitate quick data transfers. Drakewell’s platform offers a specific solution for the oil and gas sector, integrating management of personnel, assets, and drilling activities.
PHDWin provides a platform for visualizing and managing oil and gas reserves, which includes creating efficient workflows and conducting analyses. Customizable visualization solutions offer significant benefits, including seamless integration with existing systems and processes, crucial for operational efficiency.
Hence, customization and integration features cater to the unique needs of each industry, making visualization tools a versatile asset.
Scalability and Performance
When selecting visualization tools, scalability and performance are vital considerations. They must be able to handle increasing amounts of data as businesses grow. Business expansion often requires visualization tools to extend their capabilities to new areas, necessitating a scalable approach.
The ability to adapt visualization tools rapidly to changes in industry standards and practices is crucial. Innovative technologies such as AI can help visualization tools adapt by learning from new patterns of data. While scaling, it is imperative to maintain, if not improve, the performance of visualization technology to ensure continued efficiency in operations.
Thus, scalability and performance are crucial for visualization tools to adapt to growing businesses and maintain efficiency.
Real-Life Success Stories: RenderGeek's Industrial Visualization Projects
 Created by RenderGeek
Real-life success stories demonstrate the transformative impact of industrial visualization compellingly. RenderGeek’s industrial visualization projects have led to increased efficiency, reduced time-to-market, and cost savings for clients across various industries. Clients have reported up to a 20% increase in efficiency after implementing RenderGeek’s bespoke visualization systems.
RenderGeek’s industrial visualizations have also assisted companies in:
reducing operational costs by identifying inefficiencies
mitigating risks and anticipating challenges before they escalate
achieving a 15% reduction in waste materials through improved resource management and planning
Summary
In conclusion, the power of industrial visualization in transforming industries is undeniable. From enhancing product development to streamlining processes and reducing costs, visualization technology is a catalyst for innovation and growth. Whether you’re in the maritime, oil and gas, aquaculture, or construction industry, embracing visualization technology could be your pathway to operational efficiency and sustainable growth. Let’s envision a brighter, more efficient future with the power of visualization.